Why Add Google Analytics to Your Shiny App?
Understanding how users interact with your Shiny app is key to improving its performance and user experience. Google Analytics provides powerful tools to track app usage, identify popular features, and gain actionable insights. Best of all, it’s free to get started.
In this guide, we’ll walk you through the process of integrating Google Analytics with your Shiny app, step by step.
Step 1: Create a Google Analytics Account
- Visit Google Analytics, and click “Start measuring”.

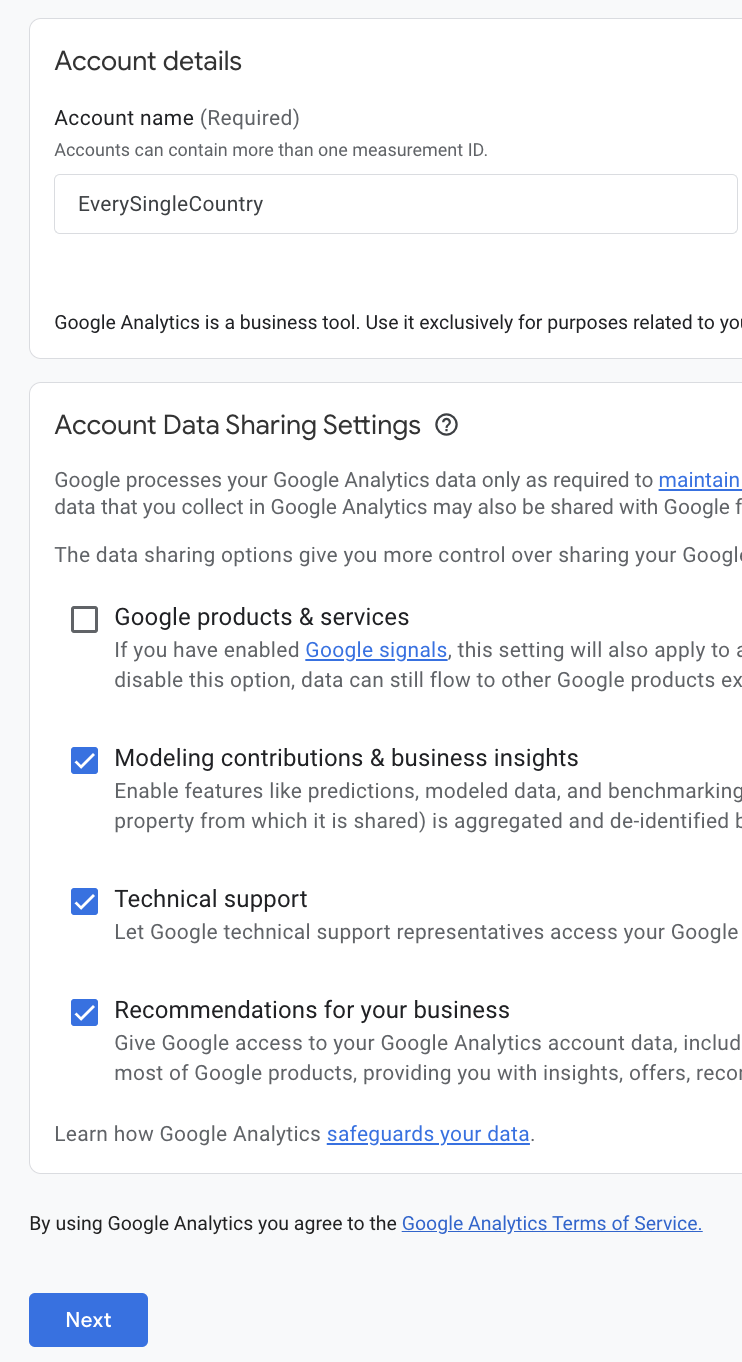
- Fill in your “Account details”, agree to the terms, and click “Next”.
Step 2: Set Up Your Property
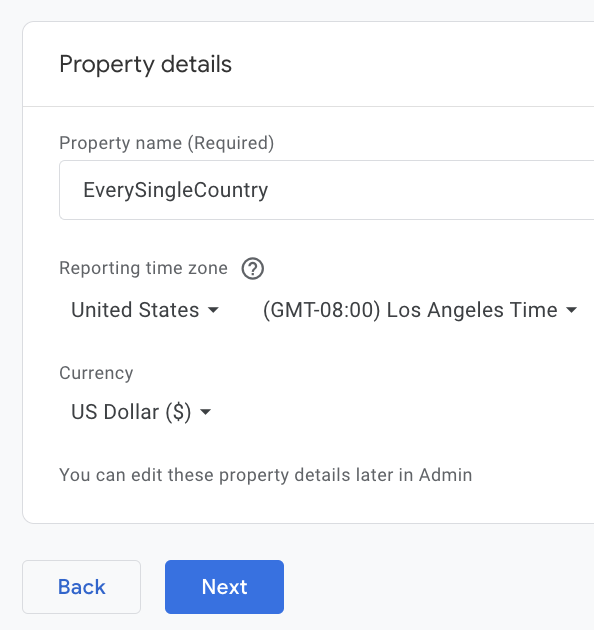
- Enter your “Property details”, such as your app name and time zone, then click “Next”.
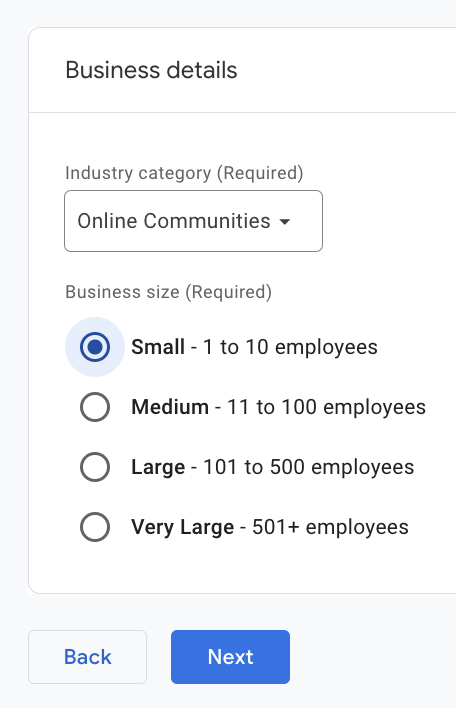
- Provide your “Business details”, and click “Next”.
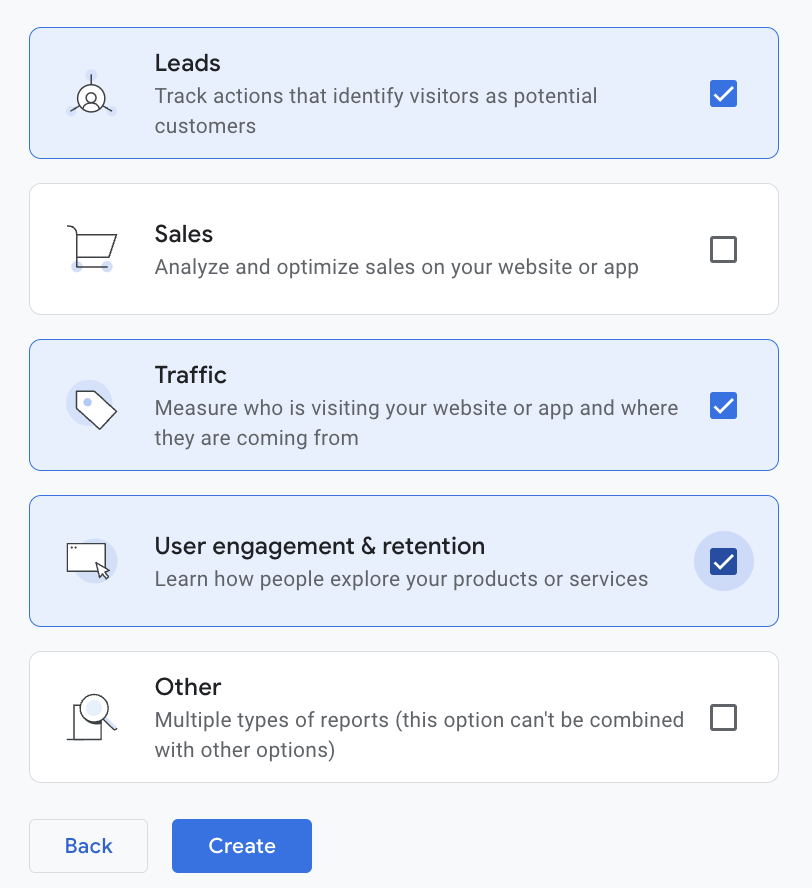
- Select your business objectives (e.g., measure user engagement), and click “Create”.
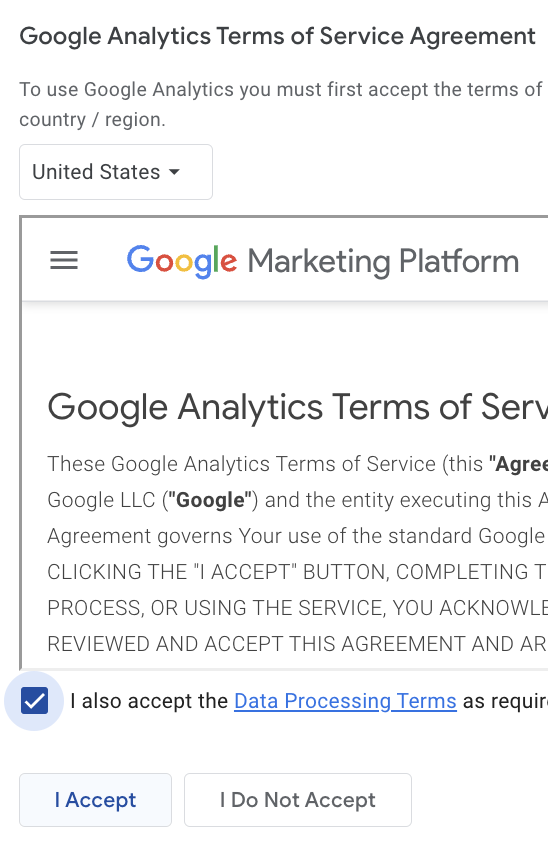
- Accept the terms of service to proceed, and click “I Accept”.
Step 3: Configure Your Data Stream
- Select the “Web” platform.

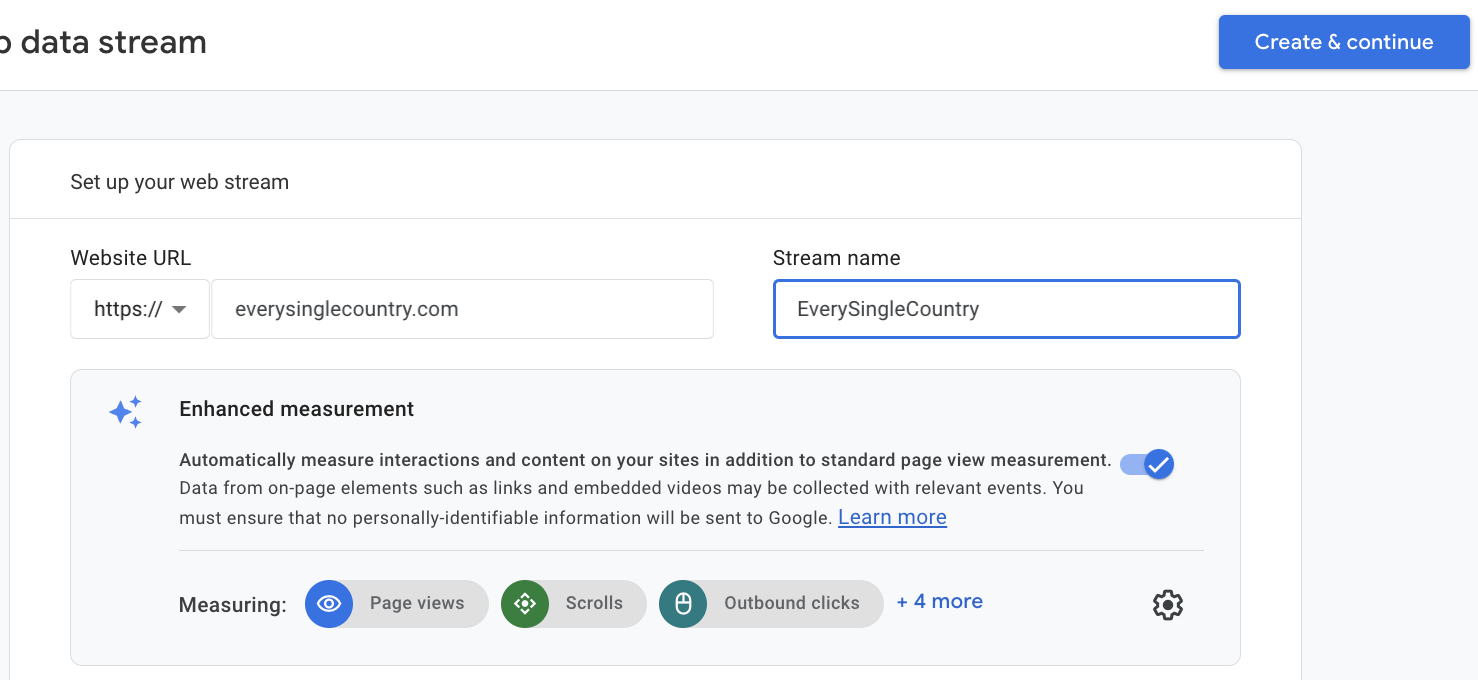
- Enter the public “Website URL” of your Shiny app, give a “Stream name”, and click “Create & continue”.
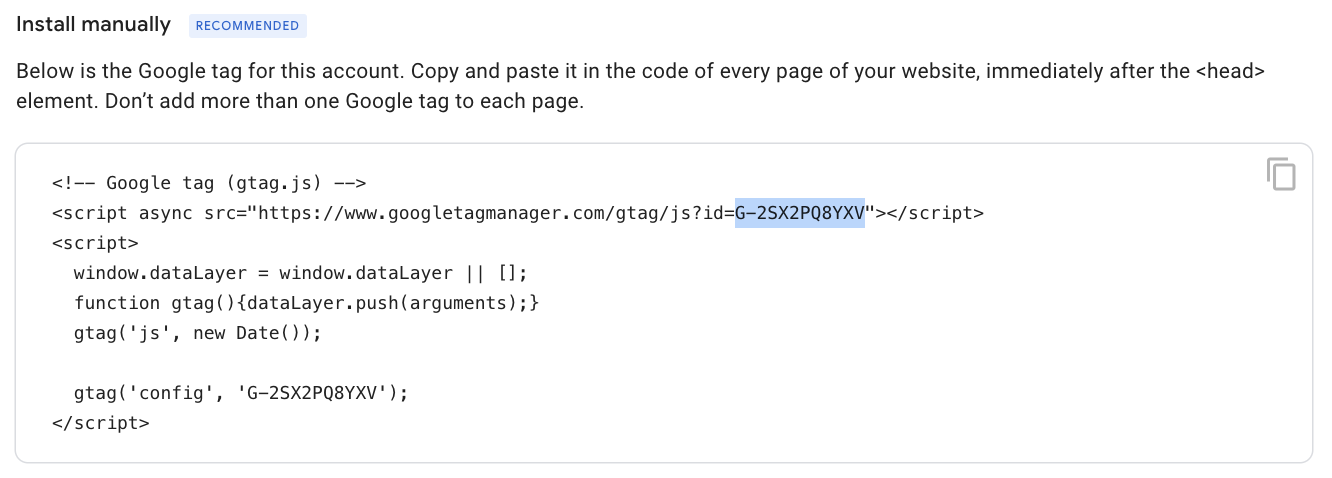
- Copy the Google Analytics ID generated for your app (e.g.,
G-ABCD12E34F).
Step 4: Add Google Analytics to Your Shiny App
To connect your Shiny app to Google Analytics:
- Include the Google Analytics
gtagcode in your app’s UI. To simplify this, use the pre-written R function from this gist. Copy theuse_google_analyticsfunction definition in your code, or directlysourcethe gist:
source(paste0(
  "https://gist.githubusercontent.com/jcrodriguez1989/a6a9c4168262e99ef2f9c70a110886ab/raw/",
  "ea6b48e1cdaaed2839524ad700a930f6d17583d2/ga_setup.R"
))- Update your Shiny app’s UI code, it should look smimilar as shown below:
ui <- fluidPage(
  use_google_analytics("G-ABCD12E34F"),
...- Re-deploy your app to your hosting platform.
Step 5: Test Your Installation
- Return to the Google Analytics dashboard and click “Test installation”.

- If everything is set up correctly, you’ll see a success message confirming that Google Analytics is tracking your app.

Final Step: Monitor Your Data
- Wait a few hours for data collection to begin. Then, use the Google Analytics dashboard to explore user interactions, track app performance, and gain insights into how users engage with your app.


Congratulations!
You’ve successfully integrated Google Analytics into your Shiny app. With this setup, you can make data-driven decisions to improve your app and deliver a better experience for your users.
Let me know in the comments if you have any questions or need further assistance.